This algorithm produced substantial and consistent revenue for my price comparison website for ten years. Today, I will share the details with you. This blog post builds on my previous post on search ambiguity. The general logic I used as the basis for this algorithm is still sound and valuable, but perhaps not for price comparison websites due to market changes which I will explain in my conclusion.
Defining the Problem
Pay-per-click (PPC) keyword advertising allows you to bid on phrases that users type into search engines such as Google and Bing. You compete in an auction environment against other advertisers, and your bid amount will significantly influence your placement on the search engine result pages (SERPS). (advertiser quality metrics also impact placement)
An automated algorithm that calculates bid amounts that will maximize revenue must predict the potential value of each click. To estimate future value, you may use past performance as a guide. Estimating the gross value per click works better when tracking revenue from onsite advertising and sales. Examples of onsite advertising are Google Adsense, Google Search Ads, and banner ads. If your website is focused on sales, predicting conversion rates based on past sales and having historical conversion rates front and center in your analytics can have great benefits. The two metrics we seek to calculate are defined below:
- Value Per Click = Total Revenue / Total Clicks
- Conversion Rate = # Sales / Total Clicks
Long-tail search phrases typically have very low volume. The long-tail phrases I targeted for this post’s algorithm were designed to be so specific that they referred to a single unique product. The landing page for these long-tail keywords would display that product, and no competing advertisements would be present. The algorithm’s goal was to maximize conversions and sales. A sample landing page is shown below:

The low search volume of long-tail PPC keywords can be quite problematic. I typically used more than a year’s data to make my predictions. To give you a rough idea of the problem, one of my Bing account’s activities shows that 1.8 million keywords received 125,588 clicks for the entire year! While my overall keyword and click volume was much higher, this account’s extreme example illuminates the fundamental problem. Only 7% of the keywords in this account had activity, and I need to accurately predict the value per click for all 1.8 million keywords!
A Scary Situation or Why Transparency is Good
“Your opinion on how predictive systems should be architected will change if you have skin in the game” Dr. Evan Coopersmith (2018). Truer words were never spoken! Full transparency and easy debugging were a requirement for the conversion rate and value-per-click predictor mentioned in this blog post. This predictive algorithm was used by an automated bid algorithm that would set the bid on millions of PPC keywords twice a day. With a daily PPC budget of $20K, a software glitch could be very costly. There were many layers of safeguards throughout the system, including an outlier detection Cron job that would curtail rogue behavior. Still, it was possible to lose many thousands of dollars in a short period. Because of the risks involved, the solution I implemented is based on intuitive, easy-to-understand rules and code that facilitate logging decisions and replaying calculations.
PPC Bid Algorithm Overview
My PPC bid algorithm uses the following logic:
- Group similar products
- Calculate the median conversion rate and value per click for the group
- Calculate a trending conversion rate adjustment ratio
- Calculate a PPC bid based on the value per click and the conversion rate adjustment
The algorithm is pretty straightforward. The logic I use to create minimal product groupings and the trending conversion rate formula are the most interesting aspects, in my opinion.
Intelligent Segmentation to the Rescue
I targeted precise long-tail keywords because they indicate the searcher is in the late stages of the purchasing funnel. These search terms tended to be used so infrequently that predictions could only be made by grouping similar keywords. The attributes I used for grouping keywords were the secret sauce. Over the years, I have had many ideas concerning attributes that would indicate product and keyword similarity. The attributes below proved to be the top performers that could reliably group keywords.
- The source of the traffic (Bing Ads, Google Ads, Bing Partner Network, Google Content Network)
- The algorithm used to generate the keywords
- The price of the product SKU
- The taxonomy nodes assigned to the product
Common sense should explain why these attributes effectively group similar PPC keywords. In my experience, the best predictive algorithms are based on easy-to-understand and verifiable assumptions.
Each search engine has its quirks. Search partner networks tend to have lower-quality traffic due to system abuse (e.g., web admins pushing the limits to maximize profits). Different keyword-generation algorithms will have varying levels of ambiguity. For example, while being very explicit, a “Dewalt 1/2 inch 18v hammer drill” is still more ambiguous than “Dewalt DCD805B”. A $20 product may have an extremely short purchasing funnel and fall into the impulse purchase category. A $2,000 LED Smart TV is not an impulse buy and will have many aspirational window shoppers. Lastly, products in the same family tend to have common conversion rates. For example, a bobblehead doll will convert much differently than inkjet printer cartridges. Still, an HP inkjet cartridge and a Brother inkjet cartridge will have similar conversion rates if all other attributes are equal. Taking this a step further, printer paper will have a conversion rate that more closely aligns with inkjet cartridges than bobblehead dolls.
A Hierarchy of Increasing Precision
My value per click or conversion rate predictions aim to gather historical performance data from the minimal set of keywords needed to have confidence that the calculation is statistically significant. So, in T-Test parlance, a P-Value of .05 or lower. The historical performance data is organized into a tree, and I start at the leaf level and navigate upwards until I have enough data. As I navigate up the tree, the similarity between products will become more vague. We will lose predictive precision if we include too much loosely related data.
Let’s first discuss product taxonomies. The Google shopping product taxonomy is ubiquitous in e-commerce because its assignment to products is required if one wants to advertise their products in Google Shopping. When I discuss taxonomies, I will use the shorthand L1, L2, L3, and L4 to refer to the level in the taxonomy hierarchy. L1 is the broadest and most ambiguous level, and L4 is the most precise.
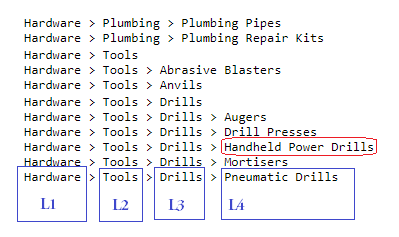
The above image shows a portion of the Google Shopping taxonomy for the Hardware (L1) taxonomy node. A Dewalt Hammer Drill would live in the “Handheld Power Drills” L4 node.
To understand how I organize products and PPC performance data into a precise hierarchy please consider the following Venn Diagram for a Dewalt Hammer Drill.
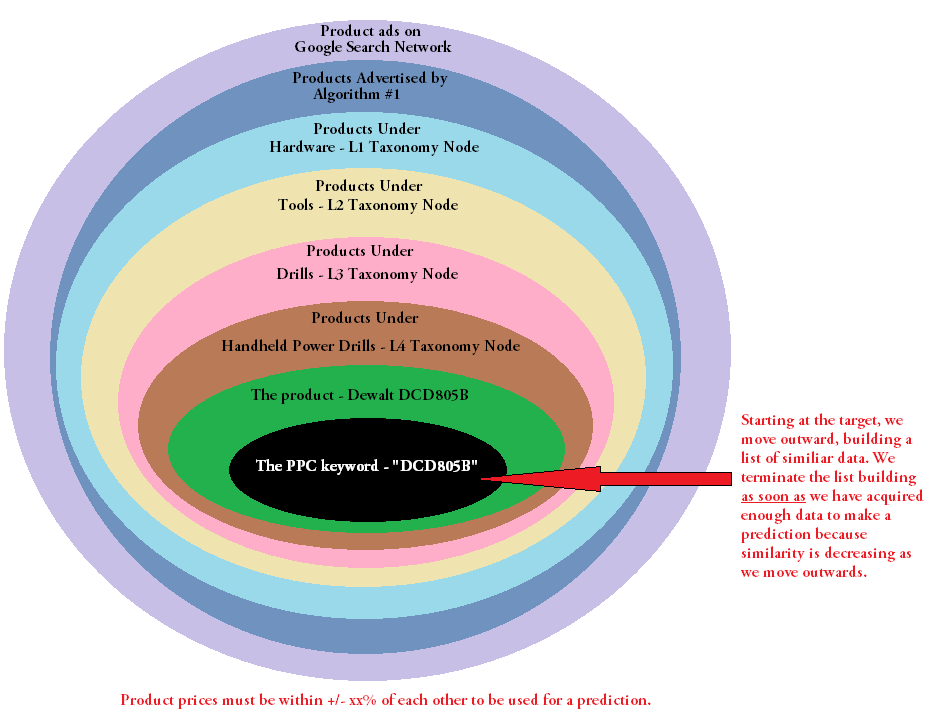
In this diagram, I have rolled up all the child nodes of a taxonomy branch into the parent node. This means that a product and corresponding performance data will be duplicated in L1, L2, and L3. Lastly, products may exist in multiple taxonomy nodes. De-dupe logic is required.
When gathering historical data for predicting value per click or conversion rates, I will start at the center of the Venn diagram (e.g., the keyword level) and move outwards, accumulating data until my calculations determine I have enough information to make a reliable prediction. Ideally, I would have enough performance data to predict an individual PPC keyword’s future performance based solely on its own historical data. Single keywords sometimes have enough data for prediction but it is rare.
Each level in the hierarchy aside from the inner-most keyword level contains a a list of product data that looks like this:

As my predictive algorithm traverses the Venn diagram hierarchy, moving out from the center, it accumulates PPC keyword historical data by adding the above JSON data to a list. It stops the traversal when enough data has been accumulated to make a prediction. When enough data has been accumulated, the algorithm calculates the conversion rate or value per click for each keyword and returns the median value from the entire group.
Adjusting for Consumer Trends
The only thing certain in e-commerce is change… Wars, political intrigue, competition, natural disasters, recessions, holidays, time of year, and a near infinite number of situations can change consumer behavior. To compensate for the variability of consumer behavior I used the following, simple technique. For a particular product price range I would roll up all clicks and all sales for the past year and calculate a conversion rate. I would then do the same for the last 1 to 2 weeks. I then establish a bid adjustment ratio to apply to all calculated bids! To recap, the trend adjustment calculations look like this:

I also have holiday-specific boost code, but that code feels more like an art than a science due to the yearly changes in consumer behavior. Past performance is no guarantee of future results. The above code works well and will even help Cyber Monday bids by leveraging Black Friday performance data.
In Conclusion
In this post I have outlined an easy to understand and debug algorithm for reliably predicting the value of each PPC click by leveraging historical data. I should point out that I used this approach on a price aggregator website where the data was very fluid. For example, Amazon could be running a Prime Day sale with savings that last only a few hours. Zoro.com might have a very aggressive coupon that only applies to certain brands for five days. Items would frequently go out of stock or be discontinued and the price leader would be continually in flux. This predictive algorithm was designed to perform well in a fluid marketplace where I had no control over the product offerings.
Price comparison websites have been beaten by the direct integration of price comparison into Google and Bing search engines. Google Ads and Bing Ads have supplied their clients free conversion tracking scripts and now integrate the conversion data into their PPC analytics. This gave Google and Bing the “keys to the kingdom” as they now know the relative performance of all search phrases. Their price comparison widgets will tend to show more prominently as the users “telegraph” they are in the late stages of the purchasing funnel via their search specificity. This has the unfortunate side effect of crowding out 3rd party comparison engines.
The predictive algorithm I defined in this article worked exceptionally well. Once or twice a year for ten years, I refactored and enhanced this algorithm by incorporating new data sources, segmentation ideas, and rules. My next article will describe a technique for scoring new product desirability by leveraging OpenAI embeddings, keyword tags, and true/false conditionals.


Leave a comment